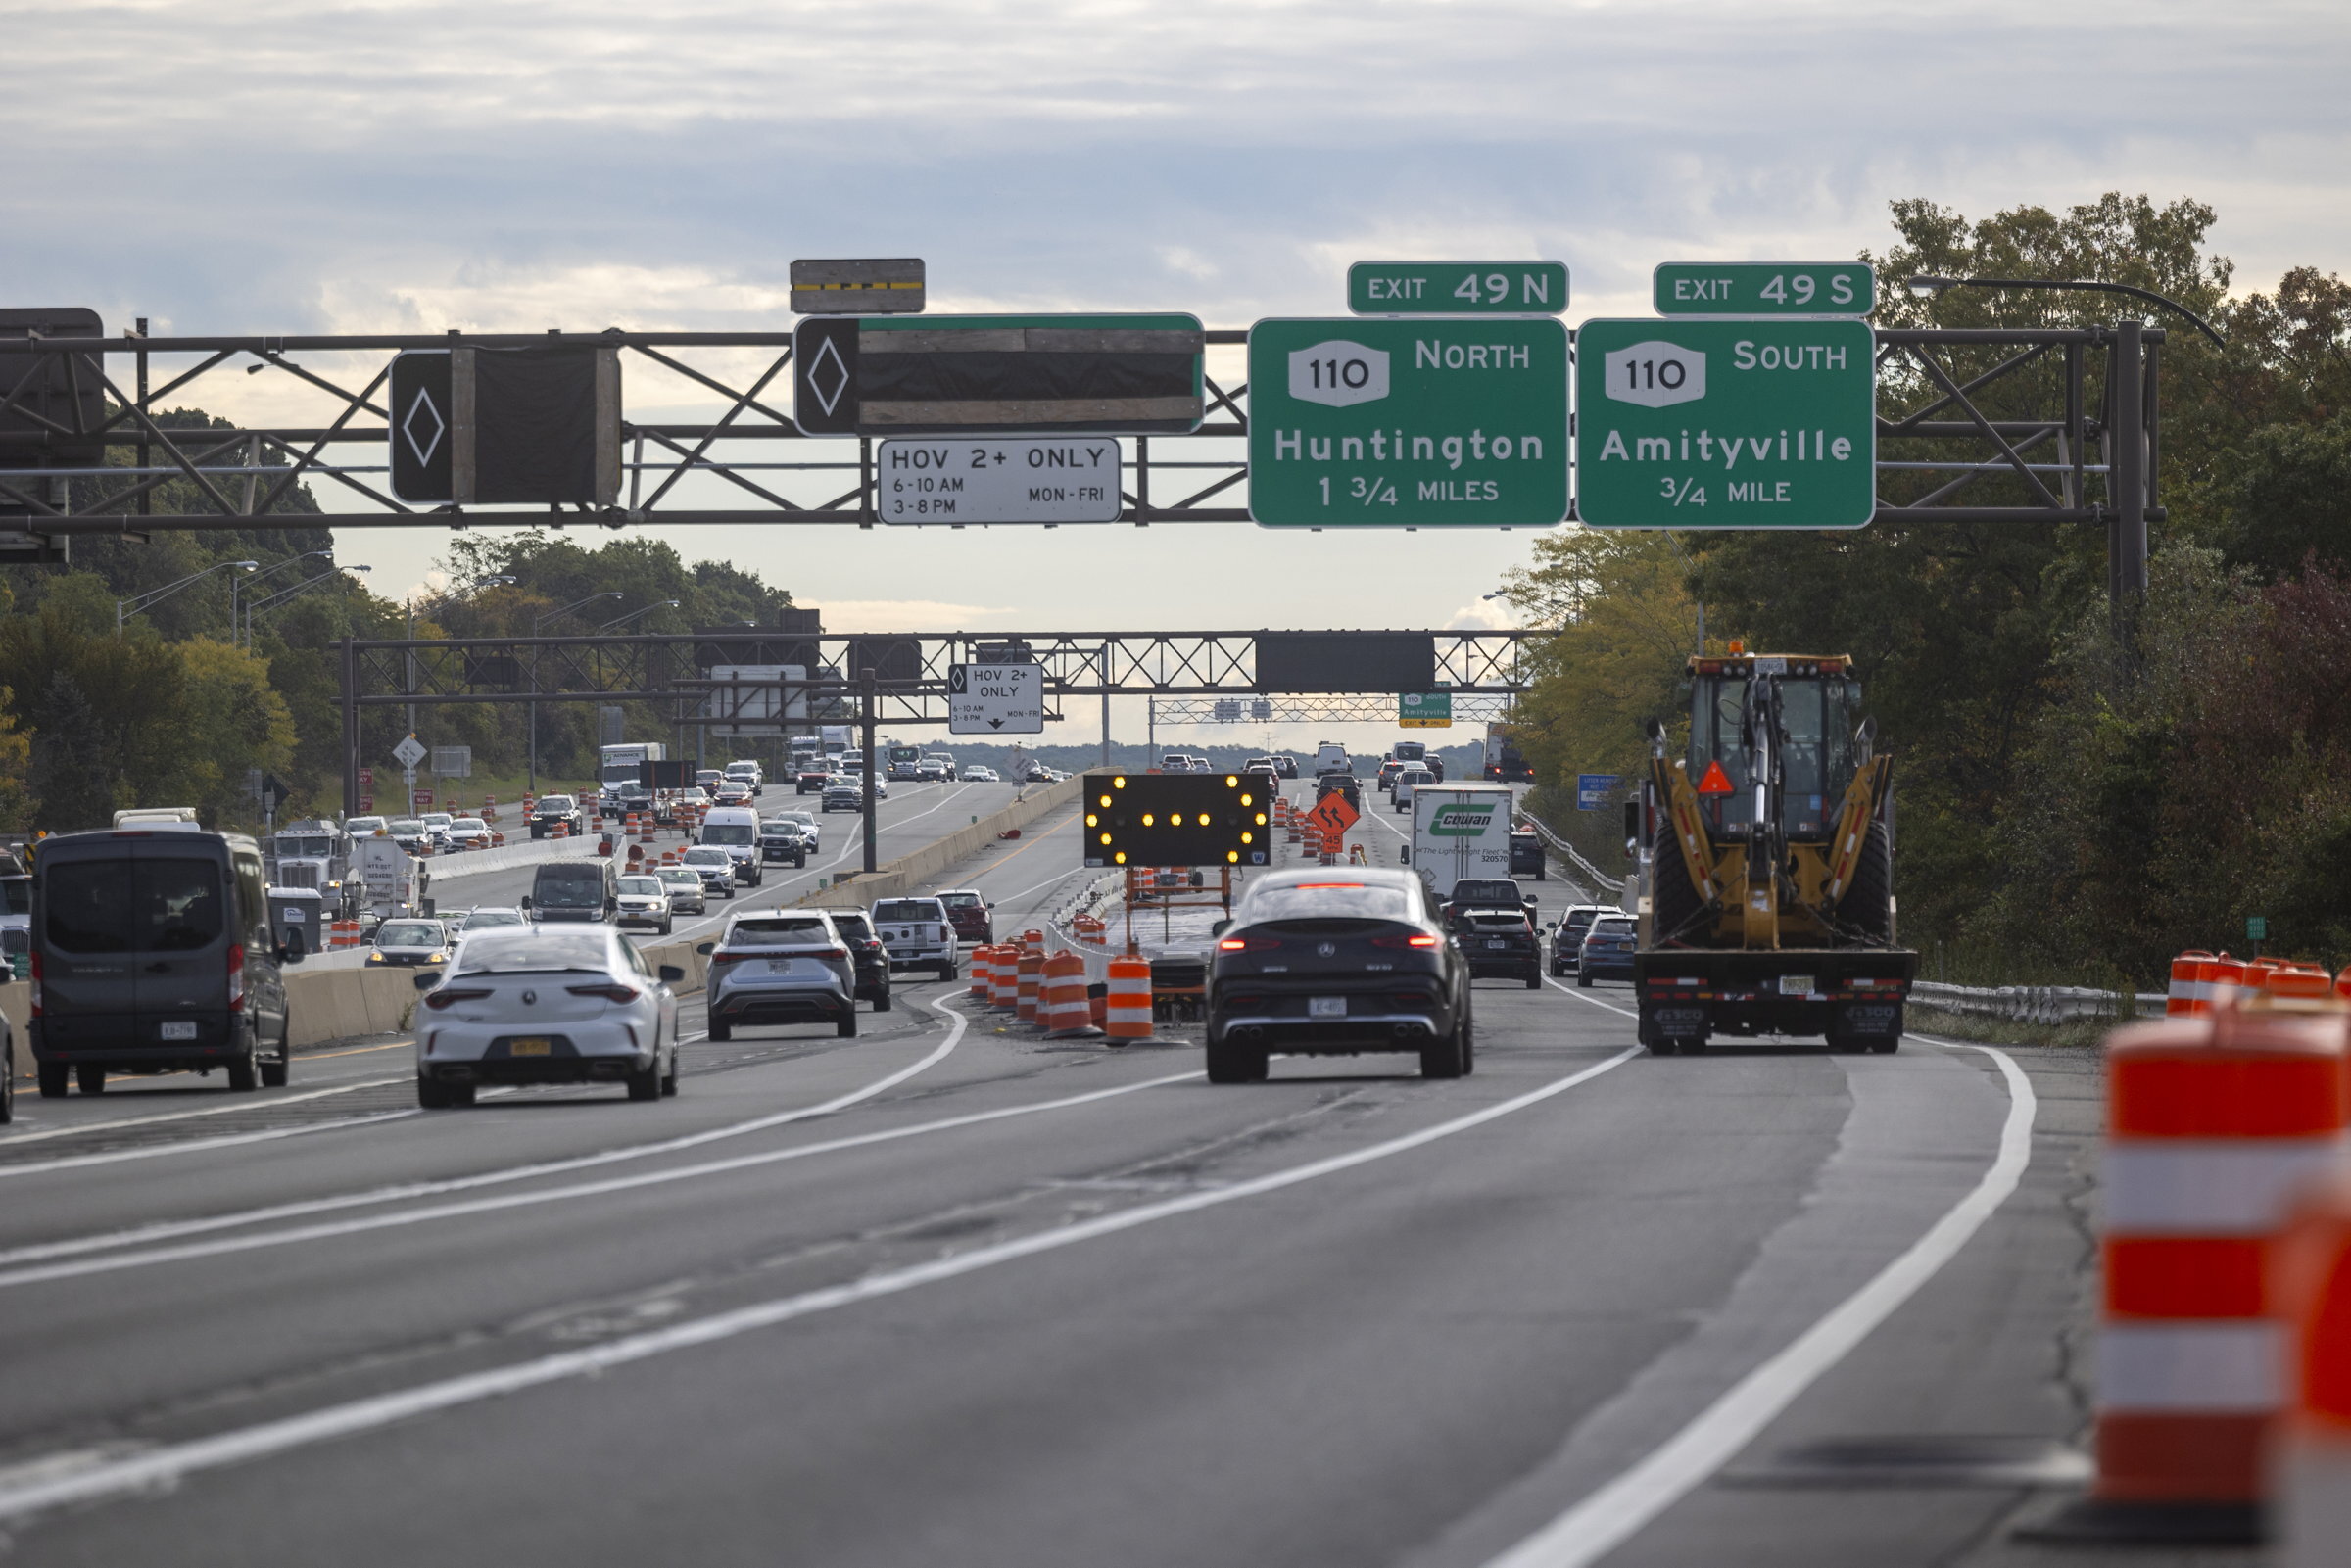
Long Island statistics: Roads and rails
Roads and rails
Monitor data and latest coverage here on Long Island's roads and rails.
Map: 2022-2024 crashes on Long Island
See the most dangerous roads in your neighborhood.
Explore here
Database: Tracking LI’s deadly crashes
Search fatal crashes using our interactive database — updated daily
Latest crashes here
Worst Long Island roads by crashes
The Southern State Parkway has consistently had the highest number of crashes on any single road over the last decade.
More hereCollisions higher during evening rush hour
More than 23,000 incidents involving crashes took place between 3 p.m. and 7 p.m. during the evening commute in 2024.
More analysis hereFridays are LI's most dangerous day to drive
In 2024, data showed that about 15.9% of all motor vehicle crashes on Long Island took place on Fridays.
More analysis herePercent of fatalities involving drivers using drugs or alcohol from 2019 to 2023
Nassau County and Suffolk County percentages are higher than New York State.
More hereRail ridership
While there were more than 65.2 million riders on the Long Island Rail Road in 2023, ridership has not yet returned to pre-pandemic levels.
Latest on LIRRLong Island traffic fatalities by type
Drivers and passengers vs. pedestrians, cyclists and others.
More here